|| Orders || Customers || Top Customers || Sell-Through ||
|| Quantity Issues || Sync Events ||
Orders
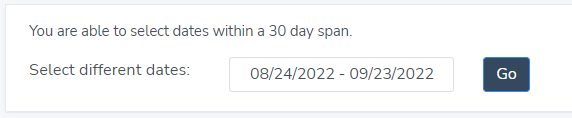
All orders can be found under the Orders tab on the left hand side of the navigation panel. This includes transactions that happened both on your Point of Sale and on your eCommerce website. SKU IQ aggregates this data on to the Orders tab so that you can see how your business is performing over the last 30 days. You can change the date increments as well (up to 30 day spans) by using the calendar function at the top of the screen. You can, of course, look at singular days as well as full months if you so choose.
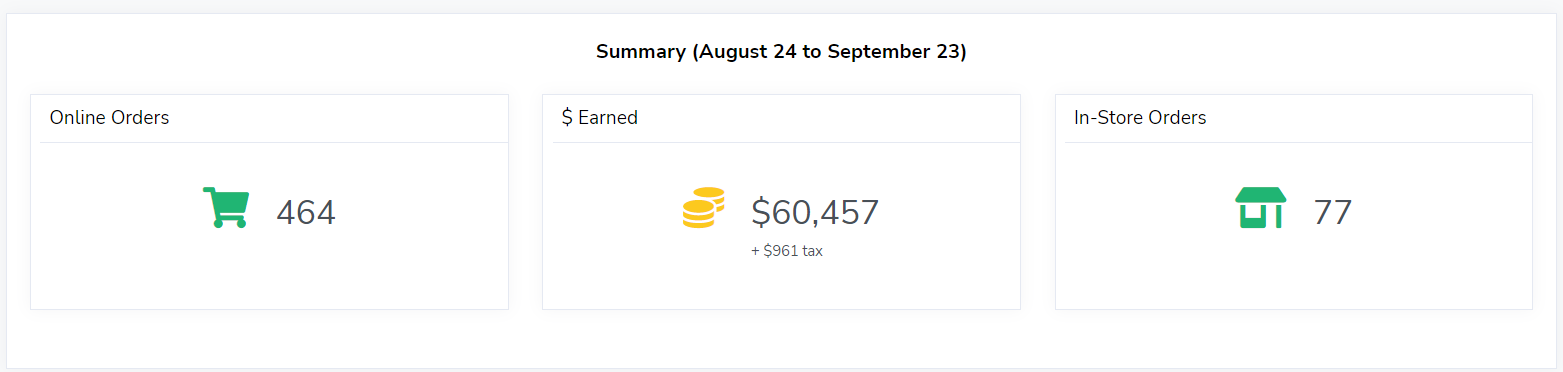
The order tab will also display how many orders you've had on both your point of sale and on your eCommerce website as well as how much revenue you've earned during that given time span as well.
Below this, the Order History is displayed. There are options to download the full report as a CSV file, as well as options to display only the in-store sales or the online sales or both.
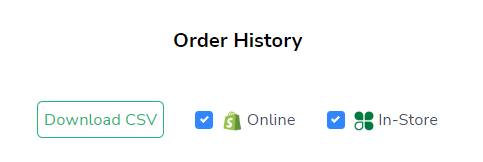
💡 You will need to use Microsoft Excel, Google Sheets, or a similar spreadsheet program in order to open and view the CSV file.
The following headers are available both on the Orders Tab as well as in the CSV file:
- Order/Invoice # - this is the order or invoice number that your Point of Sale or eCommerce system will generate. This may be formatted differently depending on which platforms you are using
- Date - the date on which the transaction took place
- Online - displays the eCommerce icon if the order was placed online, otherwise displays a -
- In-Store - displays the Point of Sale icon if the order was placed in-store, otherwise displays a -
- Type - will usually display "mail" for online orders, unless scheduled for pick up in store, or blank for in-store orders
- Customer - will show the customer's name if captured by the system
- Cost - will show the unit cost(s) of the items(s) purchased on the transaction if entered
- Sub-Total - displays the total prior to taxes or any discounts
- Discounts - shows any discounts that were applied to a transaction
- Tax - shows any sales tax applied to a sale; not all transactions will display this information, we cannot pull this information with all integrations
- Delivery Fee - displays any shipping & handling or delivery fees that a buyer had to have paid for their product(s)
- Total - shows the final total after discounts, taxes, shipping, and any other fees
You can click on any order number to pull up the transaction to see what was purchased.
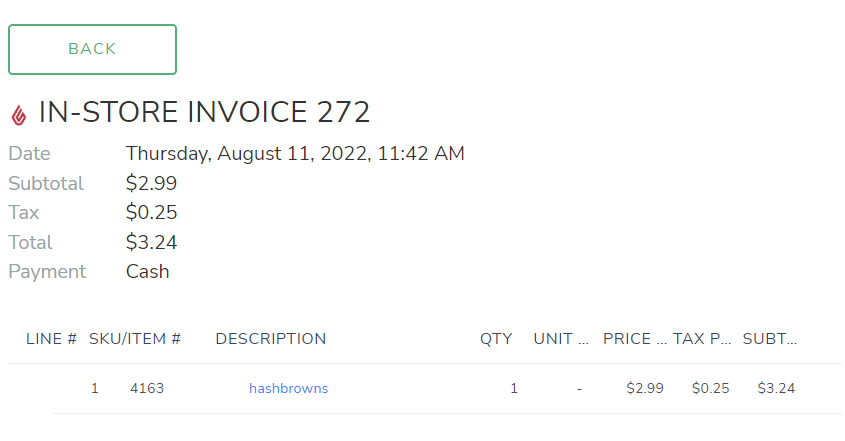
This is also where you would perform any manual fulfilments of orders if you are a customer with has a multi-location setup for their physical retail.
Customers
 The Customers Tab aggregates data collected from both your in-store Point of Sale and your eCommerce website. While the data is currently not available to download, it is still a handy reporting tool that allows you to see who is shopping at your store. The report will show the email address of the patron, how many times they have shopped at your store (both online and in-store), show a delineation of where they shop more often, and what was the last day that they purchased anything from you.
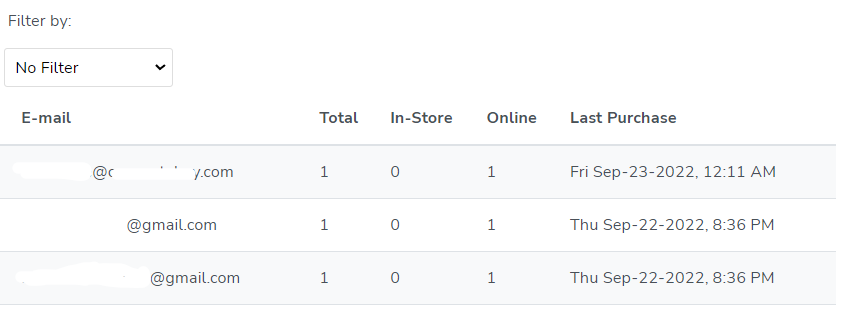
Much like on your inventory page, you can filter by In-Store, Online, and both In-Store and Online customers using the Filter By drop down menu.
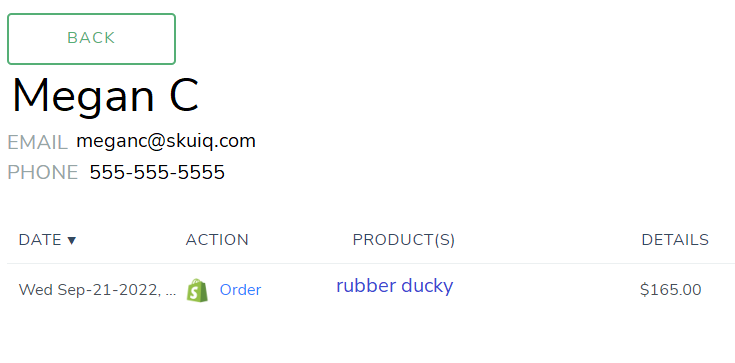
Clicking on an email address will take you to a customer's profile within SKU IQ. It will display the captured name, email address and phone number, as well as any purchase they have made.
Top Customers
 The Top Customers tab will show you your top few customers both online and in-store within a given date range. Much like the Customers tab, if you click on the name of one of the patrons, it will show you their customer profile in SKU IQ. If there are more than one transaction in the date range, those will be displayed on the customer profile. The dollar amount of the Top Customer tab itself is the sum of all transactions within that date range.
This tool can be very helpful for when you have a repeat customer you would like to reward with a discount code.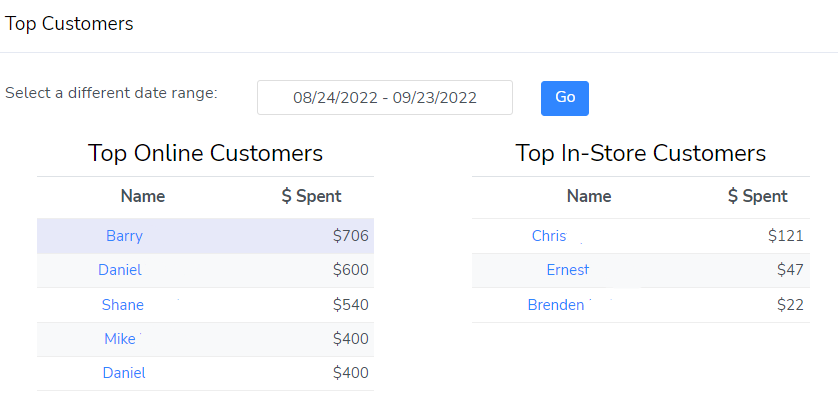
Sell-Through
The Sell Through Report is one of the handiest reports that SKU IQ has to offer you. The Sell Through Report offers key insights on how your inventory is moving over all over a given period of time. The maximum time span available at the moment is 30 days. This report updates in near real time.
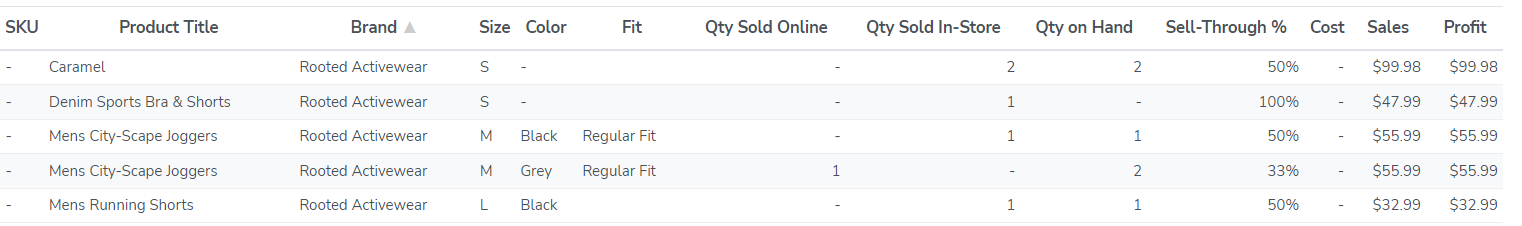
The Sell Through Report breaks down what items that have sold, including what variants have sold. Each item variant is displayed as a separate line item. You can group them by clicking on the green "Group By Product" button at the top.
 This report gives you insight on what items are more popular online than in store as it shows you how many have sold both on your eCommerce website and in your physical store. It is also handy to know what items you need to reorder based on how many you've sold through. The Sell-Through % takes in to account how many you've sold both online and in-store and how many you have on-hand left. This tool is very handy when looking at trends during different seasons as well as seeing what is popular so you can quickly re-order stock.
One of the most unique features of this report is that if you have entered your unit cost (cost-to-you) in either your Point of Sale or eCommerce (or both), we can calculate your profits for you! This can be super helpful when you're doing accounting at the end of the month, quarter, or year. This report is downloadable as a CSV file for ease of use and record keeping.
Quantity Issues
This tab is not available for all merchants at this time.
The Quantity Issues tab gives you insight on whether or not inventory quantities have been communicated properly. SKU IQ can run in to issues where there's a disconnect between our platform and your eCommerce and/or Point of Sale due to outages, exceeding rate limits, and many other factors. We try to keep track of what's happening in the meantime and deposit that information in the Quantity Issues report. The report runs daily.
If there are no issues to report, SKU IQ will indicate that is the case. However, if there are issues to report how many issues it has found. This handy report is where you can resolve any quantity issues that may arise quickly. Like the link report, the purpose of this report is not only to give you insight as to what items are having difficulties syncing, or if you had an outage that needs to be reported to your hosting service or Point of Sale, it allows you to quickly overwrite the incorrect quantity with the correct information by selecting the radio button for your Point of Sale or your eCommerce platform.

You can perform this action for each individual item or you can do so in bulk by clicking the radio buttons directly next to your Point of Sale or eCommerce icons at the top of the list. If you're not sure which inventory is correct, it may be a good idea to do a physical count of the item(s) in question.
This report will also tell you when SKU IQ first noticed the mis-match in quantities, which can allow you to further troubleshoot with your platform providers if there is an issue.
Sync Events
This report is an endless scrolling page which allows you to see exactly what is happening on your SKU IQ account in real time. Not only will sales appear here, you will also see quantity changes and any updates to synced product data. This can be very useful for both you and us for troubleshooting purposes. This report can be narrowed down to specific days or date ranges and can be searched by SKU number. If you are not using SKU numbers for your inventory items, you may want to start doing so!
What is a "Sync Event" though? It's any change processed through SKU IQ - whether that's a sale or a quantity change. Quantity changes happen in real time, but it may take sales data and product attribute changes a little while longer to sync.
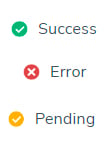
Each event is color coded with easy to understand icons. The green check mark means that the sync event completed successfully! There was no error with that event. The red "x" means that there was a problem what that sync event. If you see red "x"'s please report them to Support. The yellow check mark means that the event is pending start or is in progress. You will most often see the yellow check mark when a full sync of one of your platforms is in progress or pending in our queue.